I am currently in the process of (perhaps) buying a new camera. Currently I have a Sony A6000 with one standard zoom lens that has a focal length that goes from 18-50mm (or 24-75mm if you translate to 35mm sensors).
The cameras I’m looking at currently are full-format cameras, and the lenses for those cameras can get quite expensive – so I’m wondering if I can get away in the beginning just buying a fixed lens for the camera (cheaper).
The structured approach would of course be to analyze my photos taken with the zoom lens and see which focal length I use the most – since I want to get better at Python I decided that writing a Python script for this was the way forward. The script turned out to be quite short – the only dependency I didn’t already have installed was pillow.
The programming part
First we need to see if we can get the focal length easily, searching the spec for suitable EXIF information I found that 41989 is the key with the descriptive name “FocalLengthIn35mmFilm” – let’s try that!
import PIL.Image
import matplotlib.pyplot as plt
FocalLengthIn35mmFilm = 41989
img = PIL.Image.open("image.JPG")
exif_data = img._getexif()
print exif_data[FocalLengthIn35mmFilm]
It seems to work for most of my images, lets loop through all images in the folder and try it out
import PIL.Image
import matplotlib.pyplot as plt
import glob, os
for file in glob.glob("./**/*.JPG"):
  FocalLengthIn35mmFilm = 41989
  img = PIL.Image.open("image.JPG")
  exif_data = img._getexif()
  print exif_data[FocalLengthIn35mmFilm]
This appears to be working for most of my pictures – some images doesn’t contain any FocalLengthIn35mmFilm parameter so I’m skipping those images for now with a try/except and logging to stdout.
Instead of printing the sizes I need to add it to an array to visualize it with a histogram – check below for finished script.
Finished script
import glob, os
import PIL.Image
import matplotlib.pyplot as plt

focal_length_35 = []
FocalLengthIn35mmFilm = 41989

# Go through all JPG-files in all folders
for file in glob.glob("./**/*.JPG"):
    img = PIL.Image.open(file)
    exif_data = img._getexif()
    try:
        focal_length_35.append(int(exif_data[FocalLengthIn35mmFilm]))
    except:
        print "ERROR in file %s" % (file)
# Show histogram
plt.hist(focal_length_35)
plt.show()
Running the script above in a folder with some pictures gave me the following histogram
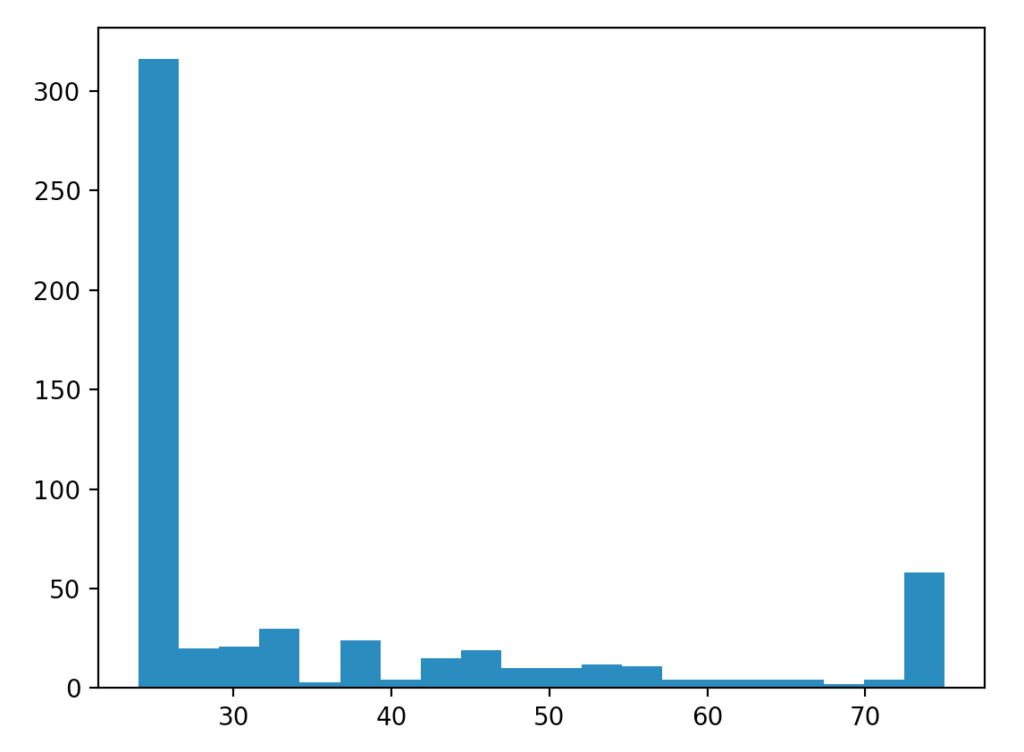
It seems that I’m a clear fan of focal length 24mm (at least for the folder I ran this on), something to think about at least. Now I probably need to go through all photos and separate the ones I like the most so I know which focal length I’m most happy with (the above script only gives me quantity, not the quality).
